Powered by Stats, Backed by Logic
Powered by Stats, Backed by Logic
Decoding charts is about interpreting the underlying market structure and recognizing the behaviour of price through volume, momentum, and time.
The purpose of posting blogs under the “Decoding charts” category is to help traders understand when to take the right decision based on the right combination of technical, fundamental and quantitative analysis.
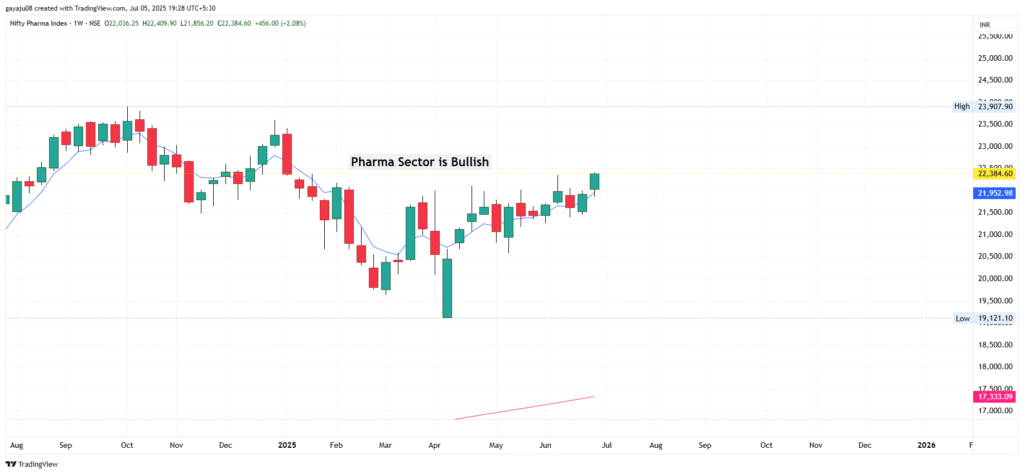
The given chart shows that the Index Nifty Pharma is bullish and following the index, stocks in Pharma sector are showing probable bullish momentum.
The Stocks which we have chosen are bullish stocks staying above 200EMA with good potential for breakout with high volume and their quarterly results are positive.
Nifty Microcap 250
Industry Pharma
Quarterly Revenue and Quarterly Net Profit is Positive
Entry: Around 900
I Target: 985 and II Target: 1081
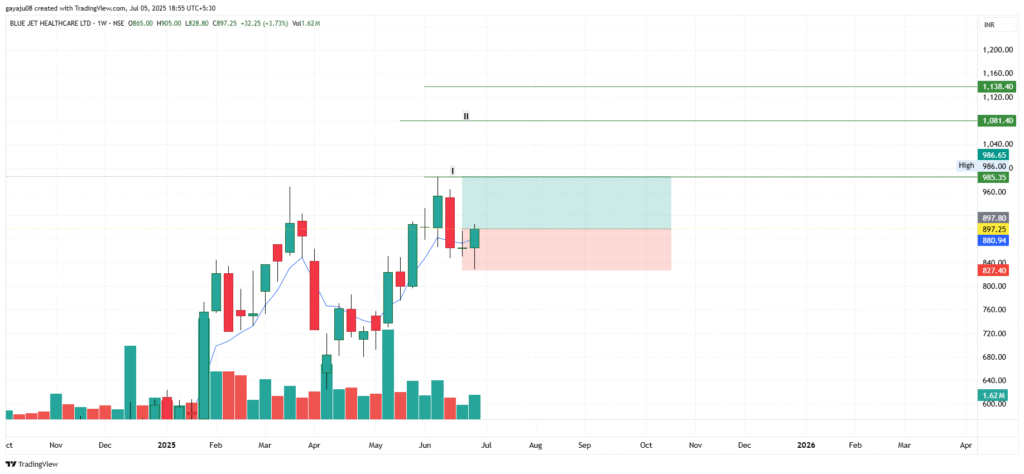
fig 1.1
Nifty Midcap
Industry Pharma
Quarterly Revenue and Quarterly Net Profit is Positive
Entry: Around 740
I Target: 841 II Target: 908
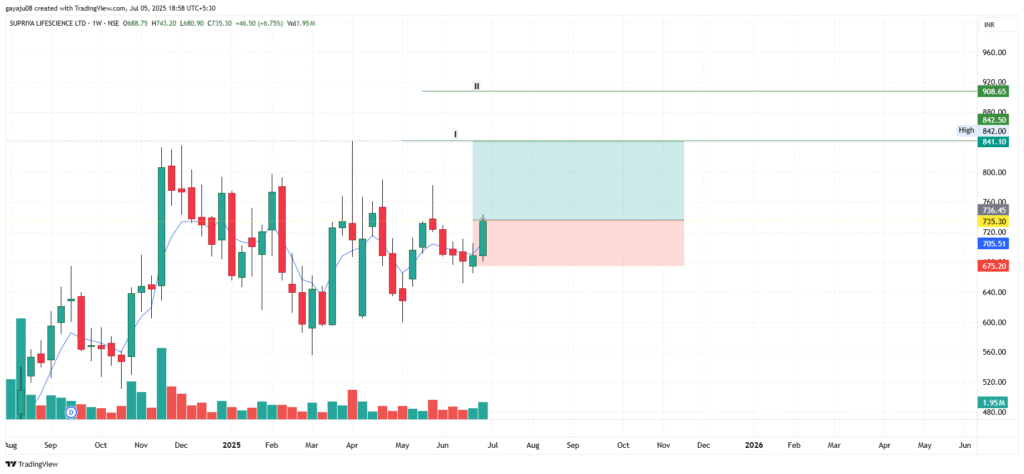
fig 1.2
These charts should help you analyse the forthcoming probable momentum in stocks. These stocks may reach their target either in a week or in a few weeks.
Please exit 80% of your position in the first target and balance in the next target. Before trading with real money, consider practicing the paper trading.
Position Sizing – Help Traders in Profiteering
Take your position sizing seriously, so you can maintain a calm and relaxed mindset while holding the position for one or several weeks.
Risk per Trade: Do not risk more than 2% of your capital on a single trade (₹1,000 for ₹50,000 capital)
Position Size=Risk per Trade (Entry Price – Stop Loss Price)
For example, if your entry is ₹1,000 and stop loss is ₹980, risk per share is ₹20, so you can buy up to 50 shares (₹1,000/₹20)
Whether you are a beginner or a seasoned trader, StatStock is here to support your growth, enhance your strategy, and help you build wealth — one calculated trade at a time.